0
Skip to Content
Who We Are
Our Story
Little Rock Office
Nashville Office
What We Do
Financial Planning
Investment Management
Work With Us
The Client Experience
Understanding Investor Fees
Resources
Market Returns
Investor Education
2026 Important Numbers
Client Login
CONTACT US
Open Menu
Close Menu
Who We Are
Our Story
Little Rock Office
Nashville Office
What We Do
Financial Planning
Investment Management
Work With Us
The Client Experience
Understanding Investor Fees
Resources
Market Returns
Investor Education
2026 Important Numbers
Client Login
CONTACT US
Open Menu
Close Menu
Folder:
Who We Are
Back
Our Story
Little Rock Office
Nashville Office
Folder:
What We Do
Back
Financial Planning
Investment Management
Folder:
Work With Us
Back
The Client Experience
Understanding Investor Fees
Folder:
Resources
Back
Market Returns
Investor Education
2026 Important Numbers
Client Login
CONTACT US
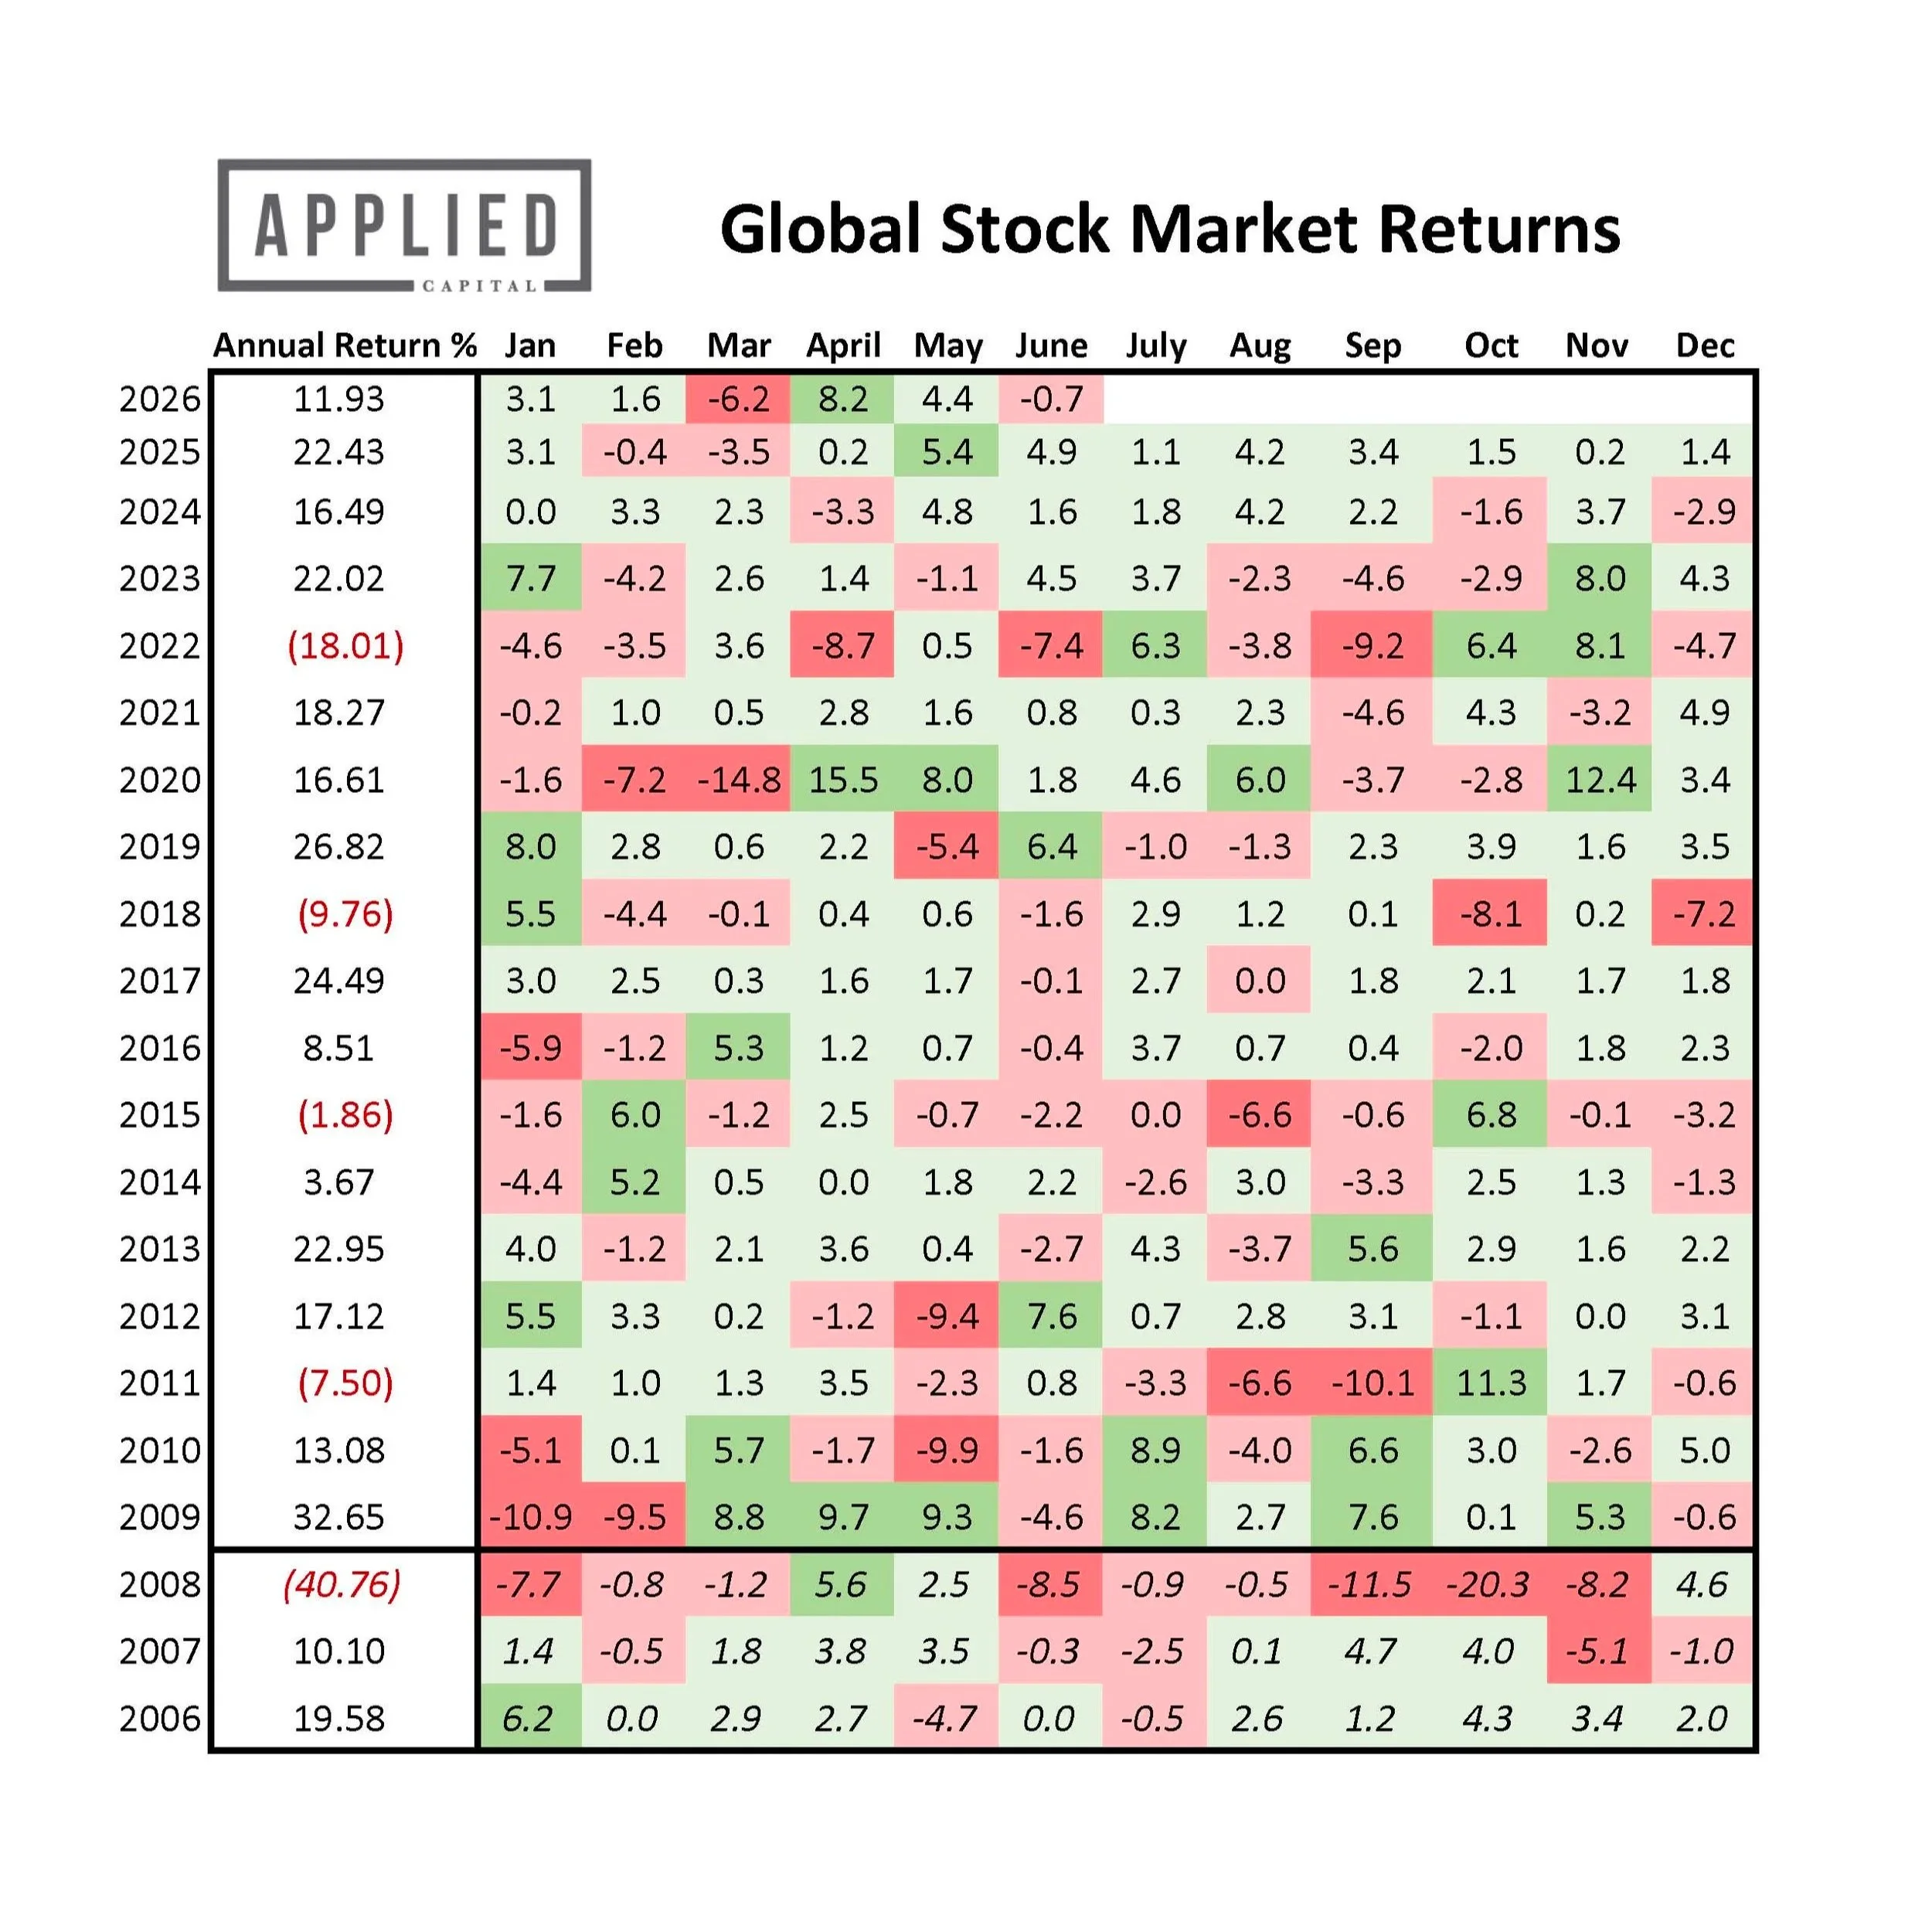
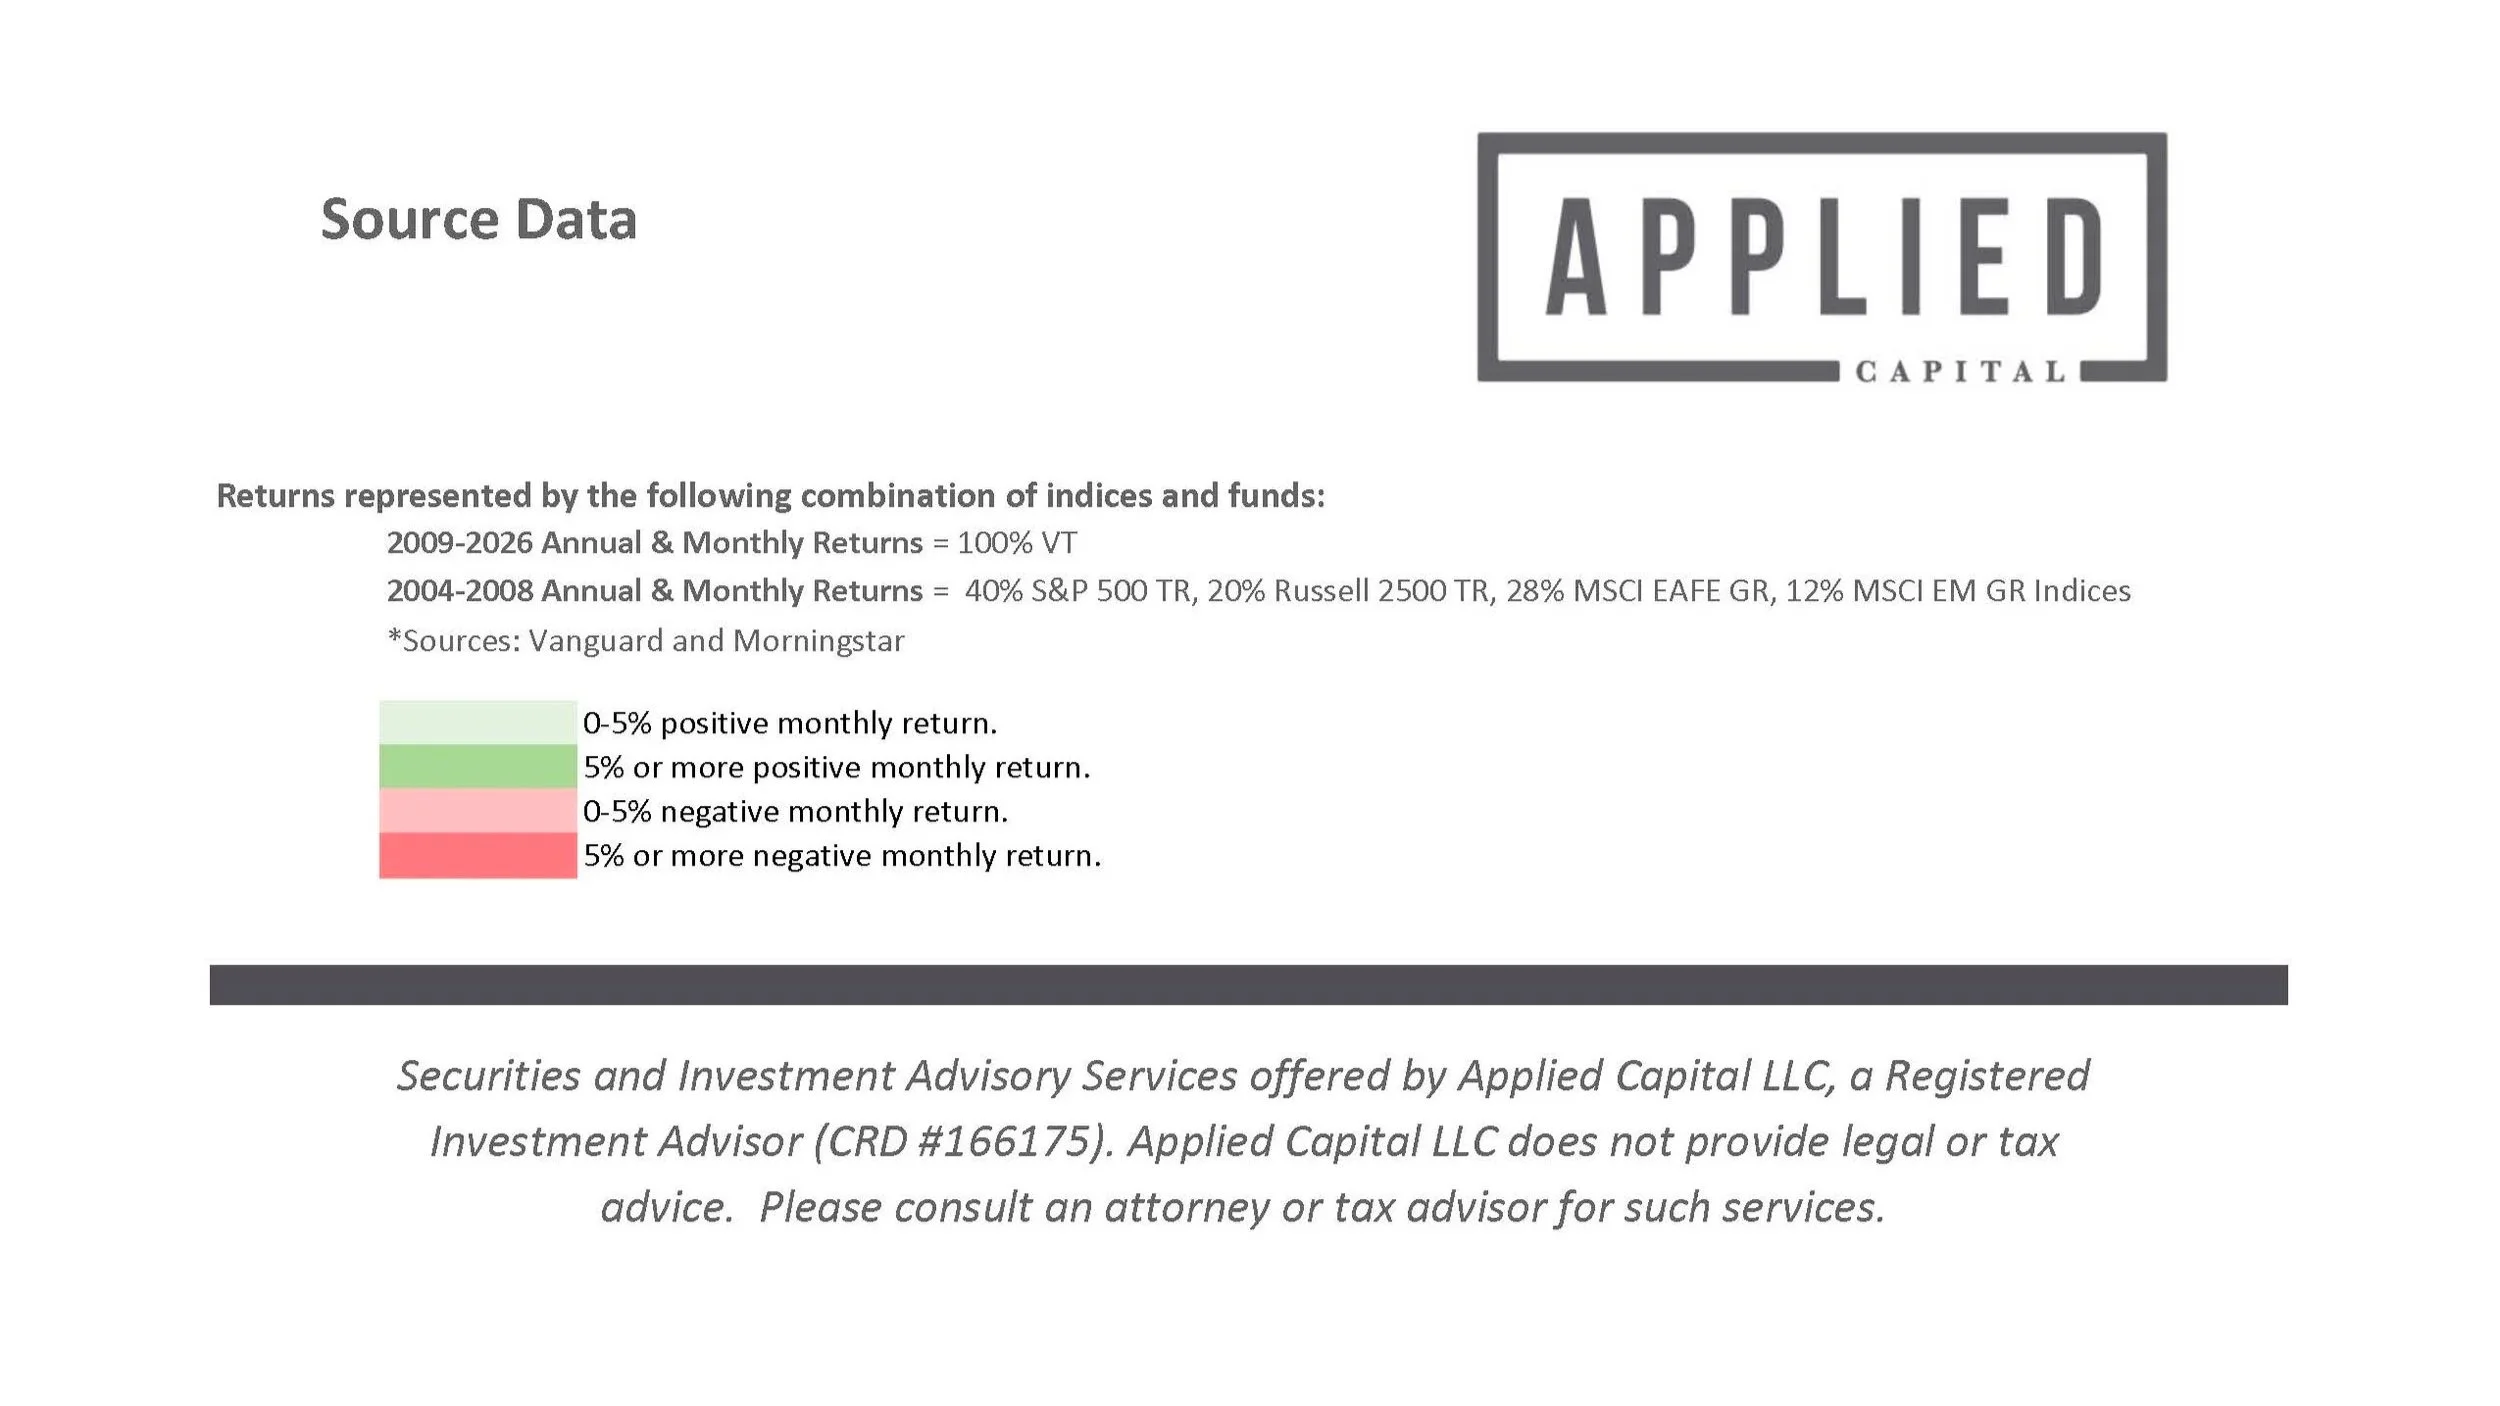
Market Returns
Ready to get started?
CONNECT WITH AN ADVISOR